Phone: 503-565-2100 


Randomness of Returns: a Visual Exploration of Asset Class Returns
Submitted by Headwater Investment Consulting on August 24th, 2016
By Kevin Chambers
As investment advisors, we comb through financial data to find trends. The data we analyze is not always easy to understand for the average investor, so for those visual learners out there, here is our chart of asset class returns.
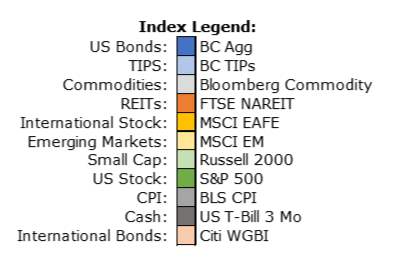
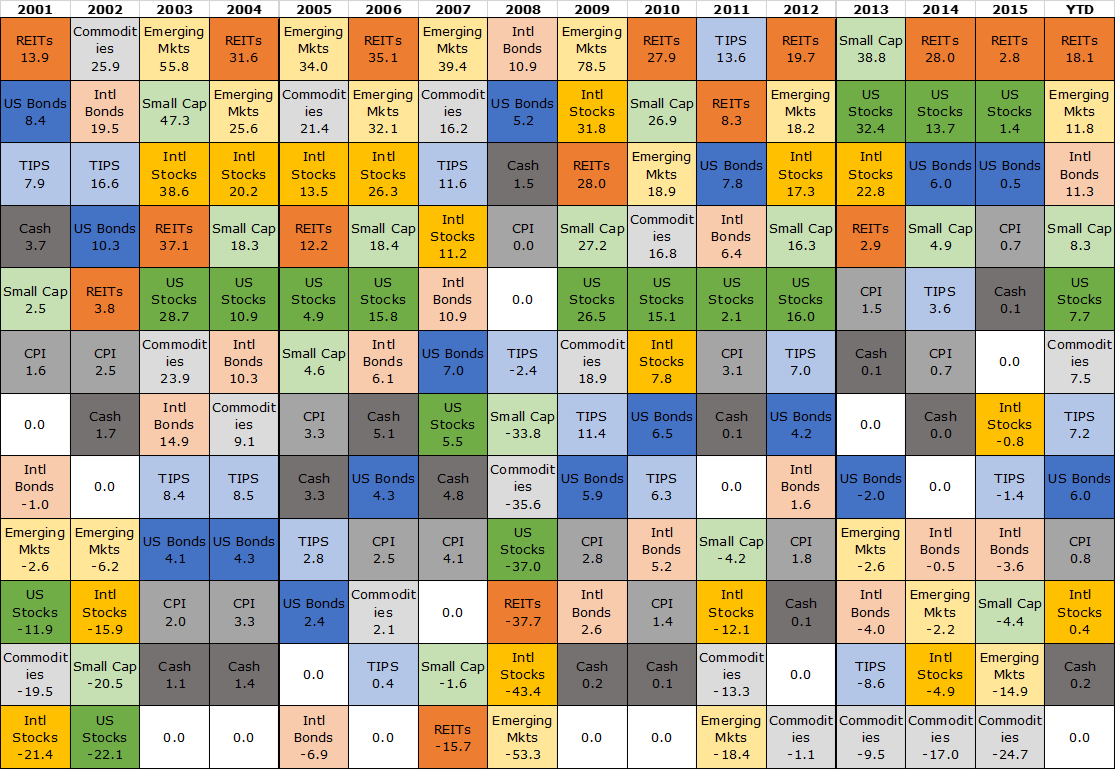
This periodic table, or quilt of returns, shows different asset classes over the last 15 years and ranks them by year based on performance. The best performing investments on top, the worst performing on the bottom.
This chart illustrates the randomness of returns. No one asset class is constantly at the top or bottom. In fact, they vary wildly year to year. This evidence supports our investment philosophy of creating broadly diversified portfolios.
Sometimes, it is important to look at the same data from a different perspective. Below are several charts based on the original periodic table. They all use the exact same data, they are just presented with a different focus.
Asset Class Returns compared to Zero Return:
This first chart takes all of the returns of the original chart but centers the boxes around a zero return.
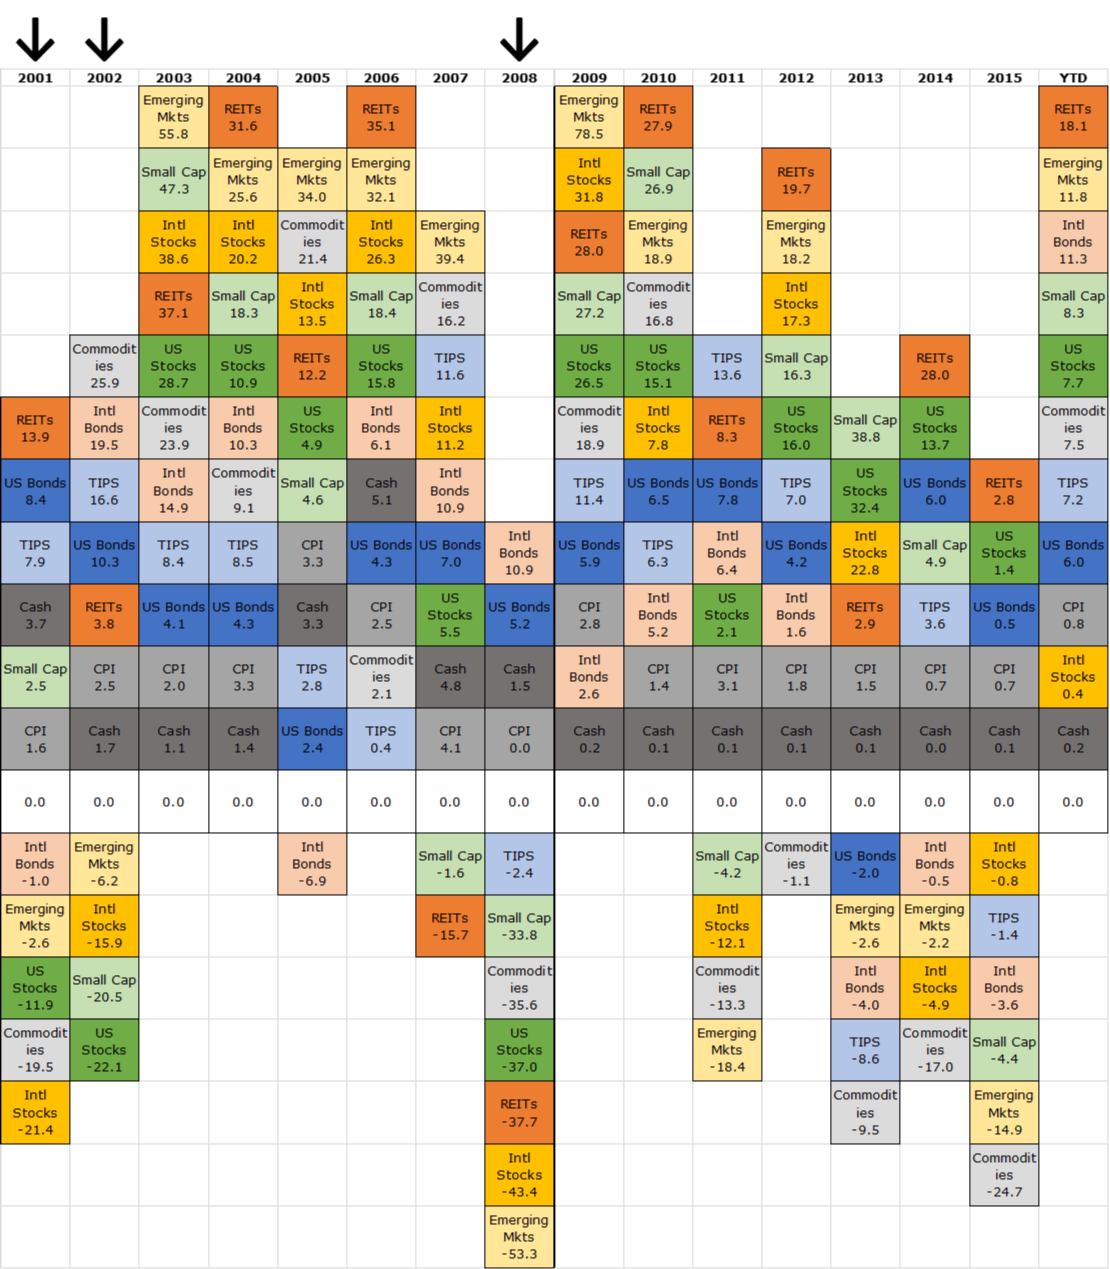
The biggest takeaway from this chart is that when things are bad (look at 2001, 2002, and 2008) almost everything suffers except for bonds (dark blue box in each column). It also shows that when the stock market (dark green box in each column) is up, usually everything else is up too.
This reaffirms our belief that bonds play an important role as stabilizers in our clients’ portfolios. In years where stocks lose, bonds usually balance out that loss with positive gains.
Asset Class Returns compared to US Bonds Returns:
The following chart shows when we make the US Bond asset class the focus.

This bond-centric view shows us that rarely are bonds a bottom-level performer. When they are (2004, 2005, and 2009), it is in years where the stock market is up. However, notice that US bonds still posted positive gains for these years. In the other years, bonds tend to be a middle-of-the-pack investment. Although they are great assets to hold for downside protection, bonds have been a pretty good generator of return for portfolios over time.
Asset Class Returns compared to US Stocks Returns:
Our last chart looks at the asset class returns by centering the boxes around the returns for the S&P 500.

This view shows us that stocks are one of the most consistent asset classes over the last 15 years. Most academic research shows that investing in a primarily US stock portfolio over long periods has generated the most return over the majority of time periods. In most years, US stocks have been in the middle of the pack or at the top of the ranking. This reiterates the importance of having a broadly diversified portfolio with a portion of your investments in the stock market as well as bonds.
These charts are not anything drastically new, just another interesting way to visualize the historical movement of returns. Headwater Investments is looking continuously for ways to analyze historical market returns in our research. Although history offers no guarantee of future results, it is valuable to analyze the data we have to help us make informed decisions concerning our client’s assets.
Source: Morningstar Direct, As of 7/31/2016